August 31, 2021 Sergey Kikevich All authors
Appendix to the article: file for download
In 2014-2016, the funded part of Russians’ pensions was frozen by the Government. The moratorium has been extended into 2021. All employer contributions now go towards the formation of the insurance part.
Nevertheless, NPFs continue to manage the funds of the funded part of the pension that have already been transferred to them. And the total volume is quite significant for the Russian economy. The total assets of NPFs amount to 3.7 trillion. rub (). For comparison, the federal budget for 2021 is 16.6 trillion. rub.
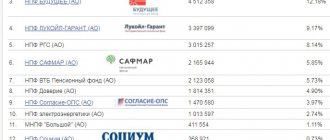
The leader in the number of insured persons is still the Sberbank fund. At the same time, over the past year, thanks to mergers, NPF Gazfond has grown almost 4 times. Now it is in second place, only slightly inferior in size to Sberbank.
Table 1
| License | Fund name | Growth | Number of insured June 2021, persons. |
| 41/2 | Sberbank NPF | 61% | 6 824 216 |
| 430 | Gazfond pension savings NPF | 365% | 6 240 726 |
| 431 | Future (Stalfond) NPF | 19% | 4 443 881 |
| 432 | Lukoil-Garant NPF | 5% | 3 504 917 |
| 407/2 | RGS NPF | 11% | 3 160 302 |
| 67/2 | SAFMAR (European) NPF | 0% | 2 269 254 |
| 318/2 | Trust of NPF | 32% | 1 960 493 |
| 269/2 | VTB pension fund | 16% | 1 542 015 |
| 434 | Consent of NPF | 14% | 1 141 535 |
| 3/2 | Electric power industry NPF | -1% | 1 058 832 |
| 78/2 | Big NPF | -5% | 409 390 |
| 288/2 | National Non-State Pension Fund | -9% | 280 100 |
| 320/2 | Society NPF | -2% | 239 215 |
| 281/2 | Magnet NPF | -8% | 222 029 |
| 56/2 | Khanty-Mansiysk NPF | -5% | 128 249 |
| 412 | Education NPF | 21% | 108 928 |
| 237/2 | Trust (Orenburg) NPF | 14% | 108 674 |
| 308/2 | Social development of NPF | -13% | 89 878 |
| 378/2 | UMMC-Perspective | 6% | 74 721 |
| 377/2 | Volga-Capital NPF | 63% | 67 027 |
| 436 | Neftegarant NPF | -8% | 65 069 |
| 347/2 | Defense Industrial Fund NPF | -16% | 58 514 |
| 437 | Atomfond NPF | -24% | 53 599 |
| 346/2 | Transneft NPF | 10% | 50 782 |
| 175/2 | Stroykompleks NPF | -3% | 42 438 |
| 433 | Surgutneftegaz NPF | 0% | 36 084 |
| 23/2 | Diamond Autumn NPF | 4% | 34 231 |
| 359/2 | First industrial alliance NPF | -8% | 32 468 |
| 12/2 | Hephaestus NPF | 25% | 32 236 |
| 57/2 | Vladimir NPF | -12% | 18 353 |
| 94/2 | Telecom-Soyuz NPF | -4% | 17 454 |
| 106/2 | Defense-industrial complex NPF | 8% | 13 227 |
| 158/2 | Rostvertol NPF | -2% | 9 799 |
| 360/2 | Professional NPF | 36% | 8 929 |
| 415 | Alliance NPF | 250% | 2 451 |
NPFs with a population of over 1 million with more than 1 million insured people are highlighted in bold.
The table takes into account only the number of people insured under compulsory pension insurance (OPI).
The number of large funds with more than 1 million insured people decreased by 2 funds, as Gazfond merged with NPF Kit Finance and Promagrofond. The consolidation of non-state funds is likely to continue. The table shows that clients mostly left small non-state pension funds and moved to larger ones. It is interesting that outflow was observed even from funds with fairly good profitability indicators according to OPS (First Industrial Alliance, Sotsium, Neftegarant, etc.).
Features for 2021 and 2021
From the table with profitability indicators, we will see that most NPFs managed to outpace inflation in the last 1-2 years. It appears that this phenomenon is primarily due to the unique situation created by the Central Bank thanks to the high key rate and record low inflation. Positive real returns (returns minus inflation) could be shown with little or no risk. To do this, it was necessary to place funds in debt securities (bonds). Apparently, those few funds that showed insufficient results, including Gazfond, decided to place a significant part of the portfolio in equity securities (shares). Only NPF Magnit showed worse results than inflation in the first half of the year.
In the future, the advantages in the performance of non-state pension funds with debt securities in the portfolio may disappear. This will happen as the gap between the Central Bank key rate and inflation decreases.
The most reliable NPFs
To understand reliability, you need to pay attention to the period from 2014 to 2021 - the time after large-scale reforms in 2012 and the crises of 2008/2014. In addition, it would not be amiss to look at the statistics during the crises themselves - this will make it clear to the investor how the management company behaves in a falling market. As a result, a citizen will be able to choose a fund, focusing not only on the rating of Russian NPFs in terms of profitability, but also on an analysis of their reliability.
- It is worth paying attention to the already mentioned Defense Industrial Fund named after. V.V. Livanova JSC NPF : we emphasize that the average historical return for 12 years in the amount of 13.46% per annum is a record among all non-state funds. In 2008, he was able to increase investors' capital by 50.29%, while others lost half or more of all investments.
- Hephaestus JSC NPF has shown excellent statistics for the last 5 years : the average annual return was 11% per annum. However, in the crisis year of 2008, the management company allowed investors’ capital to fall by -71.26%, even if it was recouped just a couple of years later. Taken together, we can say that the fund shows excellent returns during periods of growth, but in times of crisis it may misdirect funds.
- Telecom-Soyuz JSC NPF showed record growth among all NPFs in 2021, but it can hardly be called reliable: in the relatively calm 2021 there was a drawdown of -16.81%, and in the crisis year of 2008 the drop was -33.20%.
- of the National JSC Non-State Pension Fund are well protected : at a time when 2008 was ruining the funds, the management company allowed a fall of only -0.03%. At the same time, historical returns are more than sufficient for conservative investing: an average of 8.57% per annum over the past 12 years. In 2021, the growth was 9.49% per annum.
We should separately note two more funds: Professional JSC NPF and Trust JSC ONPF . Both funds not only avoided drawdown in 2008, but even increased investors’ capital by 0.13-1.20%; showed similar results at the end of 2019 - 7.28-7.31% per annum; always react to the latest economic events, and therefore do not allow drawdowns and even further increase profitability.
It is worth noting that Trust JSC ONPF practices a moderate investment strategy, not at all afraid of investing in stocks, shares and ETFs; on the contrary, Professional JSC NPF is much more conservative, preferring bonds and metals.
Thanks to this, the average historical yield of Trust is higher: 8.73% per annum versus 6.5% per annum for Professional JSC NPF. Despite their differing strategies, both funds can be called reliable based on their long-term statistics.
Rating construction methodology
The methodology for constructing the rating has been retained unchanged after significant revision in 2021. We took into account several comments made by NPF representatives.
Let us recall that the rating formula is based largely on long-term returns of funds since 2011 (7 years). In addition, profitability over the period of the last 3 years is taken into account. The latter was necessary to give slightly higher weight to those funds that have achieved improved results in recent years.
Funds with real returns less than zero for periods of 7 years and 3 years at the same time received a zero score in the rating.
Data on the results of NPF management were taken from the Central Bank website. Yields before 2011 are not taken into account in the ranking.
Choosing a company
The share of Russian NPF assets in the country's financial sector is about 4%. This indicator increases their attractiveness to the population. But there is no need to rush to transfer your pension to non-state pension funds. You need to study the market. The following factors should be taken into account:
- degree of reliability (expert opinion);
- work period;
- stability of profitability indicators;
- the presence of large industrial enterprises among the founders.
All information about the fund’s activities must be posted on the organization’s website. An indicator of company transparency is the presence of a personal account in a non-state pension fund. This option allows citizens to track their pension in the NPF.
Central Bank statistics on non-state pension funds make it possible to study profitability indicators. In order for the assessment of the fund’s performance to be objective, it is necessary to analyze the indicators over several years. An excessively high percentage of profitability should alert you. It indicates risky investment projects in which the organization is involved. A return rate that exceeds the inflation rate is considered good.
results
table 2
| License | Fund name | Rating |
| 434 | Consent of NPF | 100 |
| 359/2 | First industrial alliance NPF | 97 |
| 377/2 | Volga-Capital NPF | 94 |
| 320/2 | Society NPF | 91 |
| 436 | Neftegarant NPF | 89 |
| 23/2 | Diamond Autumn NPF | 86 |
| 433 | Surgutneftegaz NPF | 83 |
| 308/2 | Social development of NPF | 80 |
| 12/2 | Hephaestus NPF | 77 |
| 347/2 | Defense Industrial Fund NPF | 74 |
| 78/2 | Big NPF | 71 |
| 288/2 | National Non-State Pension Fund | 69 |
| 56/2 | Khanty-Mansiysk NPF | 66 |
| 437 | Atomfond NPF | 63 |
| 106/2 | Defense-industrial complex NPF | 60 |
| 407/2 | RGS NPF | 57 |
| 378/2 | UMMC-Perspective | 54 |
| 57/2 | Vladimir NPF | 51 |
| 318/2 | Trust of NPF | 49 |
| 237/2 | Trust (Orenburg) NPF | 46 |
| 346/2 | Transneft NPF | 43 |
| 415 | Alliance NPF | 40 |
| 67/2 | SAFMAR (European) NPF | 37 |
| 158/2 | Rostvertol NPF | 34 |
| 430 | Gazfond pension savings NPF | 31 |
| 41/2 | Sberbank NPF | 29 |
| 269/2 | VTB pension fund | 26 |
| 175/2 | Stroykompleks NPF | 23 |
| 412 | Education NPF | 20 |
| 3/2 | Electric power industry NPF | 17 |
| 360/2 | Professional NPF | 14 |
| 94/2 | Telecom-Soyuz NPF | 11 |
| 281/2 | Magnet NPF | 9 |
| 432 | Lukoil-Garant NPF | 0 |
| 431 | Future (Stalfond) NPF | 0 |
The top three included NPF Soglasie, First Industrial Alliance and Volga-Capital. The funds were highly rated due to their consistently high level of returns over 7-year and 3-year horizons at the same time. It is interesting to note that NPF Soglasiya has one of the lowest standard deviations of returns (2.06%), which is usually typical for bond portfolios. The standard deviation indicators of fund returns are shown in the table detailing the management parameters.
If NPF Soglasie remains a leader for the second year in a row (NPF Rating 2016), then the other two funds received high scores mainly due to the high management results of the last two years. Both funds are quite small in terms of the number of persons insured.
In general, of the millionaires, only NPF Soglasie showed good management results. All other large funds took positions in the ranking in the second half. This may be due to the ongoing process of mergers and acquisitions. The quality of management is still on the back burner.
Of last year's leaders, only NPF Socium remained in the top ten funds. In addition, NPF Neftegarant remains in the top ten for two years in a row.
NPF Lukoil-Garant and NPF Future received a zero score this year , since the results of their management are worse than inflation for all periods of time considered.
Table 3 displays data on the return on investment of all funds in the period 2011 - 2021. In 2021, the profitability for the first half of the year is shown.
Table 3
| License | Fund name | Real return 7 years | Real profitability 3 years | 2017/6 | 2016 | 2015 | 2014 | 2013 | 2012 |
| Inflation | 2,4% | 5,4% | 12,9% | 11,4% | 6,5% | 6,6% | |||
| VEB state securities | 8,31% | 18,29% | 11,4% | 12,2% | 15,3% | 0,0% | 6,9% | 8,5% | |
| VEB extended | 5,11% | 11,69% | 8,8% | 10,5% | 13,2% | 2,7% | 6,7% | 9,2% | |
| 269/2 | VTB pension fund | 0,08% | 10,84% | 10,5% | 10,3% | 10,76% | 4,4% | 5,9% | 8,7% |
| 41/2 | Sberbank NPF | -3,90% | 9,67% | 10,1% | 9,6% | 10,70% | 2,7% | 7,0% | 7,0% |
| 432 | Lukoil-Garant NPF | -5,39% | -0,02% | 3,3% | 8,2% | 8,96% | 6,8% | 8,9% | 7,6% |
| 320/2 | Society NPF | 6,69% | 11,68% | 9,4% | 10,6% | 12,43% | 7,1% | 8,5% | 8,2% |
| 67/2 | SAFMAR (European) NPF | 0,59% | 4,53% | 3,4% | 9,4% | 12,60% | 11,1% | 7,7% | 7,8% |
| 430 | Gazfond pension savings NPF | -2,42% | 8,86% | 2,9% | 13,2% | 13,92% | 2,8% | 7,2% | 7,7% |
| 3/2 | Electric power industry NPF | -2,15% | 1,16% | 4,3% | 8,9% | 8,46% | 9,0% | 8,4% | 7,8% |
| 431 | Future (Stalfond) NPF | -10,14% | -4,57% | 3,9% | 4,1% | 7,5% | 8,0% | 7,0% | 6,1% |
| 436 | Neftegarant NPF | 6,15% | 8,87% | 8,3% | 10,8% | 10,57% | 7,3% | 8,0% | 7,9% |
| 106/2 | Defense-industrial complex NPF | -1,04% | 13,19% | 10,5% | 10,6% | 12,87% | 1,9% | 7,0% | 7,53% |
| 433 | Surgutneftegaz NPF | 3,39% | 13,16% | 9,4% | 11,6% | 12,94% | 3,0% | 7,6% | 9,87% |
| 237/2 | Trust (Orenburg) NPF | -0,02% | 8,38% | 9,4% | 10,1% | 9,60% | 5,4% | 8,4% | 8,30% |
| 318/2 | Trust of NPF | 3,39% | 3,42% | 4,5% | 7,4% | 12,27% | 7,5% | 7,4% | 9,87% |
| 407/2 | RGS NPF | 1,05% | 9,02% | 8,5% | 11,8% | 9,56% | 7,54% | 6,22% | 7,99% |
| 78/2 | Big NPF | 2,58% | 10,54% | 10,4% | 9,6% | 11,33% | 6,15% | 7,25% | 7,67% |
| 288/2 | National Non-State Pension Fund | -0,70% | 14,76% | 12,1% | 11,5% | 11,90% | 1,65% | 4,94% | 7,02% |
| 281/2 | Magnet NPF | -6,28% | 0,22% | 2,2% | 10,9% | 7,74% | 0,86% | 13,30% | 9,74% |
| 412 | Education NPF | -2,95% | 2,49% | 6,6% | 7,0% | 9,43% | 5,91% | 8,39% | 9,58% |
| 308/2 | Social development of NPF | 0,38% | 17,02% | 14,7% | 8,6% | 14,49% | 0,88% | 6,90% | 6,10% |
| 56/2 | Khanty-Mansiysk NPF | -0,56% | 13,89% | 9,3% | 9,6% | 15,84% | 0,44% | 6,61% | 6,80% |
| 347/2 | Defense Industrial Fund NPF | 1,96% | 11,65% | 7,1% | 12,3% | 13,06% | 6,48% | 7,51% | 6,99% |
| 94/2 | Telecom-Soyuz NPF | -7,75% | 4,39% | 7,6% | 9,1% | 8,42% | 2,11% | 5,74% | 7,35% |
| 23/2 | Diamond Autumn NPF | 1,70% | 16,22% | 10,7% | 12,6% | 13,59% | 2,15% | 5,34% | 7,20% |
| 415 | Alliance NPF | -2,65% | 11,74% | 10,6% | 9,8% | 12,15% | 0,00% | 9,84% | 6,37% |
| 57/2 | Vladimir NPF | 0,23% | 9,41% | 9,5% | 8,8% | 11,92% | 5,40% | 7,46% | 7,45% |
| 377/2 | Volga-Capital NPF | 7,08% | 13,97% | 9,7% | 11,3% | 13,69% | 7,59% | 8,96% | 7,35% |
| 12/2 | Hephaestus NPF | -0,40% | 15,96% | 8,2% | 12,0% | 16,65% | 0,62% | 7,37% | 6,62% |
| 359/2 | First industrial alliance NPF | 6,60% | 15,00% | 10,2% | 12,2% | 13,34% | 2,73% | 8,68% | 8,35% |
| 360/2 | Professional NPF | -5,30% | 2,93% | 7,2% | 8,3% | 8,11% | 3,27% | 7,40% | 7,07% |
| 158/2 | Rostvertol NPF | -0,14% | 5,11% | 7,3% | 8,8% | 9,71% | 6,95% | 8,27% | 6,90% |
| 434 | Consent of NPF | 15,44% | 5,26% | 7,0% | 9,8% | 9,13% | 9,84% | 8,92% | 14,23% |
| 175/2 | Stroykompleks NPF | -2,33% | 3,75% | 5,6% | 6,4% | 12,51% | 5,01% | 7,67% | 7,28% |
| 346/2 | Transneft NPF | -1,60% | 10,86% | 9,9% | 8,8% | 12,97% | 2,38% | 6,65% | 7,16% |
| 378/2 | UMMC-Perspective | -1,90% | 13,27% | 10,9% | 10,4% | 12,75% | 2,19% | 6,07% | 6,80% |
| 437 | Atomfond NPF | 1,27% | 10,71% | 10,6% | 10,2% | 10,74% | 4,55% | 8,22% | 6,59% |
Real profitability is the final result of management after subtracting inflation.
The most profitable funds
At the moment, Central Bank data is available only for 2021 (you can view them here), since many NPFs have not yet prepared reports for 2021. Those reports that have already been published concern quarters, not the entire year. Therefore, we will consider the rating of non-state pension funds for profitability without reference specifically to 2021.
- Telecom-Soyuz JSC NPF showed a record among NPFs in terms of profitability in 2021: 15.48% per annum. The management company practices a fairly aggressive investment strategy, investing not only in low-yielding reliable assets (bonds and “protective” assets), but also in stocks, mutual funds, and ETFs. This strategy does not always bring Telecom-Soyuz good profitability or even profit, but in 2021 it produced record results.
- Gefest JSC NPF achieved 12.16% per annum over the last 2021. Coupled with stable historical profitability, this is an excellent result.
- Surgutneftegaz JSC NPF entered the market in 2014, but the young player has already shown good results: in 2021, the fund took third place among the record holders in terms of profitability, providing investors with 12.12% per annum.
- Khanty-Mansiysk NPF JSC had a good profitability in 2021 : at the level of 10.94% per annum. The average historical return, although not a record, is at least the average for the segment of non-state pension funds: 7.37% per annum.
- the Defense Industrial Fund named after A.V. can be called very profitable in the coming years V.V. Livanova JSC NPF : in total, over twelve years, the average annual return was 13.46%, and this despite the two crises and reforms that the country went through at the turn of the decade. In 2019, the management company made a confident 9.33% per annum.
It must be emphasized that there are no predictions in the field of investing, and all results from previous years do not guarantee capital growth in the future. Peter Lynch, the most successful mutual fund manager in the United States of the second half of the 20th century, wrote about this. It is possible to draw correct conclusions about the profitability of a fund and its reliability only if a fundamental analysis of its documents has been carried out: reporting, portfolio composition, opportunities for preferential taxation, speed and quality of response during crisis situations, and the security available to it (insurance or other).
Statistics
A complete table with fund management parameters for the period 2011 - 2021 is attached. The table includes the following information:
- Standard deviation of NPF return (risk)
- Average annual real return over a period of 7 years
- Real return over a period of 7 years
- Accumulated return over a period of 7 years
- Annual real return over a period of 3 years
- Real return over a period of 3 years
- Accumulated profitability over a period of 3 years
- Number of insured 2014, 2015, 2021, 2021
Market State
NPF statistics for 2021 indicate positive market dynamics. The number of citizens who placed part of their pension in non-state pension funds increased by 4 million people. The total number of participants is 34 million.
The amount of pension savings of NPFs increased over the year by 14.3%. At the beginning of 2021, the figure exceeded 2.4 trillion. rub. Over three years, their volume has more than doubled.
Despite the influence of negative factors, the position of non-state pension funds is strengthening. The total amount of assets reaches 4 trillion. rub. Of them:
- 2.4 trillion. – pension savings;
- more than 1.4 trillion. – other assets.