The economic condition of a country determines the well-being of its population, how well its citizens live, and what the country’s role is in the global economy. The economies of different countries are built on the production of goods, the extraction of minerals and the provision of services. Many countries have strong economies and a huge share of the world's GDP, while other countries have underdeveloped economies and poor populations. In many countries, inequality in population is clearly visible. Why does inequality appear and what allows a country to become developed or develop?
Countries with different economic developments have a number of differences and features in economic development. It is worth considering them in more detail.
Differences
Developed economies are those with a high gross domestic product (GDP) per person, a decent standard of living, and an equal distribution of benefits among all citizens. In these countries, services in the economy (education, health care, food, recreation, etc.) predominate over agriculture and industry, but highly developed industry provides countries with goods and influences economic growth. Such countries have modern and high-quality infrastructure.
These countries have economic systems that support stable economic growth and prosperity.
Developing countries include those states that have low gross product and income per person, and have some economic dependence on other countries (in terms of the financial system, trade and the need to export resources). There is no strict definition, but developing countries can be called those states that are not members of the Organization for Economic Cooperation and Development, because these countries do not have the characteristics of member countries of this union, namely:
- Compliance with democratic principles.
- Free market economy.
- High degree of industrialization.
- Guarantees of human rights.
- Social programs to support the population.
Many of the developing countries have high production rates and fast-growing economies (China, Russia, Qatar) and have an average level of economic system development and average levels of prosperity.
Those countries that are characterized by a predominant level of development over other countries with a developing economic system, but which do not yet have all the characteristics of developed countries, are called “newly industrialized countries”.
Among the economically weak countries, it is worth noting those with the lowest level of economic development and low rates of increase in national welfare, the absence of large-scale production and a large proportion of the population below the poverty line.
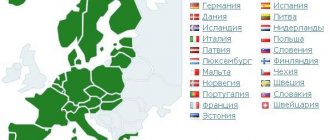
Map of developed and developing countries: developed economies (blue), rapidly developing economies (yellow), less developing economies (red)
As can be seen from the map, developed countries include almost all European countries, some Asian and Arab countries, as well as the United Arab Emirates, the USA and Canada. Countries with low living standards and weak economies are mainly located in Africa. Approximately half of the world's GDP comes from countries marked in yellow and red.
What is the Human Development Index
The Human Development Index is a comprehensive indicator that characterizes the development of people in countries around the world. This indicator is calculated by the United Nations (UN) and independent experts. The HDI indicator has been used to study social processes in the annual Human Development Survey since 1990. Before 2013, you could also come across another index abbreviation - HDI, which stands for Human Development Index.
The index was originally developed by Pakistani economist Mahbub ul Haq. After 2010, an inequality adjustment was added to the human development index and a separate index was developed that takes into account the inequality of people in education and income in countries around the world. Indices of gender inequality (inequality of rights between men and women) in countries around the world were also studied separately.
The HDI indicator is often formulated in terms of whether people can “be whoever they want” and “do what they want” in their lives. In other words, the human development index shows how well-fed, healthy, educated people can be in a particular country in the world, whether they can take part in public affairs, vote, etc. The HDI indicator is often confused with the standard of living.
Despite all the advantages of the rating, it also has a number of critics. Which indicate that the human development index lacks consideration of a number of additional indicators, for example, the crime rate, the quality of goods and services, the level of air emissions, net welfare per capita and others.
Other classifications
The World Bank provides its own classification of countries by average income per person. In this case, countries are divided into 4 groups:
- Low income (less than $975).
- Below average (more than $975, but less than $3855).
- With an average level (more than $3855, but less than $11905).
- With a high level of income (more than $11,905).
Also, the International Monetary Fund created a classification based on the following criteria for the development of countries:
- Average income of the population.
- Exports (countries whose exports account for 70% or more of hydrocarbons are not considered developed, although their GDP per person is above average).
- Integration into the global economic and financial system.
Characteristics
General characteristics of emerging economies:
- Low or middle income level, which is determined by economic growth and improvement in technology. The reason for this is that a high share of benefits is concentrated in a small group of people, i.e. in these countries benefits are distributed unevenly. And the more uneven this distribution is, the lower the standard of living.
- Low labor productivity due to lack of motivation of workers, low development of technology and outdated equipment.
- Unemployment is high and underemployment is high. This is due to an insufficient number of jobs and a small number of vacancies.
- The population of some countries of this type is growing rapidly. Although the death rate is higher than in advanced economies, population growth is driven by high birth rates. The population is growing most rapidly in African countries.
- Economic dependence on primary products (eg clean oil and gas). European countries, the USA and other developed countries concentrate their economies on the processing of raw materials and the production of secondary products.
- The economy depends on developed countries. These countries often need the technology and capital of developed countries, and they, in turn, can dictate their terms.
- Benefits are distributed unevenly. The largest share of finance is concentrated in the hands of large companies and oligarchs.
- Many developing countries lack natural resources and fertile land.
- Inefficient use of capital, finance and equipment.
- Restriction of business activities by the state.
Two types of countries for economic development and their characteristics
In addition to high salaries, developed countries use and allocate resources most efficiently. The population of these countries consumes about 85% of all natural resources, and these countries are home to about 1.4 billion people (1/5 of the world's population).
Countries with a relatively high rate of economic development, but not classified as developed, are characterized by average salaries of $900-2500. Almost 5 billion people (70%) live in such countries. The most recognizable are China, Mexico, CIS countries and Russia, South American countries, Egypt and many Arab states. The list is quite extensive, so it will not be possible to list all countries.
But the second type of developing countries with low levels of wealth and poor populations (wages less than $300 per person) are located mainly in Africa and the South Asian region. These countries are home to approximately 1 billion people (10%). Experts predict that the population of these countries will increase.
Rating of countries in the world according to the Human Development Index
In the table below you can see the ranking of countries in the world according to the Human Development Index for 2021. In addition to the main HDI, I also indicated the HDI taking into account inequality in countries and the difference between the two indicators. The higher the difference, the greater the inequality. The leader in HDI for 2021 is Norway . This has been the undisputed leader since 2009, and Norway also took first place in 2001-2006. In addition to Norway, the leaders in HDI in other years since 1990 were: Iceland (2007,2008), Canada (1990,1992,1994-2000) and Japan (1991,1993). The top 10 countries according to the Human Development Index for 2021 are as follows:
- Norway
- Switzerland
- Ireland
- Germany
- Hong Kong
- Australia
- Iceland
- Sweden
- Singapore
- Netherlands
You can see the complete list of countries in the world according to the Human Development Index in the table below:
| № | A country | HDI | HDI with inequality | HDI difference. % |
| 1 | Norway | 0.954 | 0.889 | 6.8 |
| 2 | Switzerland | 0.946 | 0.882 | 6.8 |
| 3 | Ireland | 0.942 | 0.865 | 8.2 |
| 4 | Germany | 0.939 | 0.861 | 8.3 |
| 5 | Hong Kong | 0.939 | 0.815 | 13.2 |
| 6 | Iceland | 0.938 | 0.885 | 5.7 |
| 7 | Australia | 0.938 | 0.862 | 8.1 |
| 8 | Sweden | 0.937 | 0.874 | 6.7 |
| 9 | Singapore | 0.935 | 0.810 | 13.4 |
| 10 | Netherlands | 0.933 | 0.870 | 6.8 |
| 11 | Denmark | 0.93 | 0.873 | 6.1 |
| 12 | Finland | 0.925 | 0.876 | 5.3 |
| 13 | Canada | 0.922 | 0.841 | 8.8 |
| 14 | New Zealand | 0.921 | 0.836 | 9.2 |
| 15 | Great Britain | 0.92 | 0.845 | 8.2 |
| 16 | USA | 0.92 | 0.797 | 13.4 |
| 17 | Belgium | 0.919 | 0.849 | 7.6 |
| 18 | Liechtenstein | 0.917 | ||
| 19 | Japan | 0.915 | 0.882 | 3.6 |
| 20 | Austria | 0.914 | 0.843 | 7.8 |
| 21 | Luxembourg | 0.909 | 0.822 | 9.6 |
| 22 | Israel | 0.906 | 0.809 | 10.7 |
| 23 | South Korea | 0.906 | 0.777 | 14.2 |
| 24 | Slovenia | 0.902 | 0.858 | 4.9 |
| 25 | Spain | 0.893 | 0.765 | 14.3 |
| 26 | Czech | 0.891 | 0.850 | 4.6 |
| 27 | France | 0.891 | 0.809 | 9.2 |
| 28 | Malta | 0.885 | 0.815 | 7.9 |
| 29 | Italy | 0.883 | 0.776 | 12.1 |
| 30 | Estonia | 0.882 | 0.818 | 7.3 |
| 31 | Cyprus | 0.873 | 0.788 | 9.7 |
| 32 | Poland | 0.872 | 0.801 | 8.1 |
| 33 | Greece | 0.872 | 0.766 | 12.2 |
| 34 | Lithuania | 0.869 | 0.775 | 10.8 |
| 35 | UAE | 0.866 | ||
| 36 | Andorra | 0.857 | ||
| 37 | Saudi Arabia | 0.857 | ||
| 38 | Slovakia | 0.857 | 0.804 | 6.2 |
| 39 | Latvia | 0.854 | 0.776 | 9.1 |
| 40 | Portugal | 0.85 | 0.742 | 12.7 |
| 41 | Qatar | 0.848 | ||
| 42 | Chile | 0.847 | 0.696 | 17.8 |
| 43 | Brunei | 0.845 | ||
| 44 | Hungary | 0.845 | 0.777 | 8 |
| 45 | Bahrain | 0.838 | ||
| 46 | Croatia | 0.837 | 0.768 | 8.2 |
| 47 | Oman | 0.834 | 0.725 | 13.1 |
| 48 | Argentina | 0.83 | 0.714 | 14 |
| 49 | Russia | 0.824 | 0.743 | 9.8 |
| 50 | Belarus | 0.817 | 0.765 | 6.4 |
| 51 | Kazakhstan | 0.817 | 0.759 | 7.1 |
| 52 | Montenegro | 0.816 | 0.746 | 8.6 |
| 53 | Romania | 0.816 | 0.725 | 11.2 |
| 54 | Bulgaria | 0.816 | 0.714 | 12.5 |
| 55 | Palau | 0.814 | ||
| 56 | Barbados | 0.813 | 0.675 | 17 |
| 57 | Kuwait | 0.808 | ||
| 58 | Uruguay | 0.808 | 0.703 | 13 |
| 59 | Türkiye | 0.806 | 0.675 | 16.3 |
| 60 | Bahamas | 0.805 | ||
| 61 | Malaysia | 0.804 | ||
| 62 | Seychelles | 0.801 | ||
| 63 | Serbia | 0.799 | 0.685 | 14.3 |
| 64 | Trinidad and Tobago | 0.799 | ||
| 65 | Iran | 0.797 | 0.706 | 11.4 |
| 66 | Mauritius | 0.796 | 0.688 | 13.6 |
| 67 | Panama | 0.795 | 0.626 | 21.3 |
| 68 | Costa Rica | 0.794 | 0.645 | 18.8 |
| 69 | Albania | 0.791 | 0.705 | 10.9 |
| 70 | Georgia | 0.786 | 0.692 | 12 |
| 71 | Sri Lanka | 0.78 | 0.686 | 12.1 |
| 72 | Cuba | 0.778 | ||
| 73 | Saint Kitts and Nevis | 0.777 | ||
| 74 | Antigua and Barbuda | 0.776 | ||
| 75 | Bosnia and Herzegovina | 0.769 | 0.658 | 14.4 |
| 76 | Mexico | 0.767 | 0.595 | 22.4 |
| 77 | Thailand | 0.765 | 0.635 | 17 |
| 78 | Grenada | 0.763 | ||
| 79 | Colombia | 0.761 | 0.585 | 23.1 |
| 80 | Brazil | 0.761 | 0.574 | 24.6 |
| 81 | Armenia | 0.76 | 0.685 | 9.9 |
| 82 | Macedonia | 0.759 | 0.660 | 13 |
| 83 | Peru | 0.759 | 0.612 | 19.4 |
| 84 | Algeria | 0.759 | 0.604 | 20.4 |
| 85 | China | 0.758 | 0.636 | 16.1 |
| 86 | Ecuador | 0.758 | 0.607 | 19.9 |
| 87 | Azerbaijan | 0.754 | 0.683 | 9.4 |
| 88 | Ukraine | 0.75 | 0.701 | 6.5 |
| 89 | Saint Lucia | 0.745 | 0.617 | 17.2 |
| 90 | Dominican Republic | 0.745 | 0.584 | 21.6 |
| 91 | Tunisia | 0.739 | 0.585 | 20.8 |
| 92 | Mongolia | 0.735 | 0.635 | 13.6 |
| 93 | Lebanon | 0.73 | ||
| 94 | Botswana | 0.728 | ||
| 95 | Saint Vincent and the Grenadines | 0.728 | ||
| 96 | Jamaica | 0.726 | 0.604 | 16.8 |
| 97 | Venezuela | 0.726 | 0.600 | 17.4 |
| 98 | Dominica | 0.724 | ||
| 99 | Fiji | 0.724 | ||
| 100 | Paraguay | 0.724 | 0.545 | 24.7 |
| 101 | Jordan | 0.723 | 0.617 | 14.7 |
| 102 | Belize | 0.72 | 0.558 | 22.5 |
| 103 | Suriname | 0.72 | 0.557 | 22.6 |
| 104 | Maldives | 0.719 | 0.568 | 21 |
| 105 | Tonga | 0.717 | ||
| 106 | Philippines | 0.712 | 0.582 | 18.3 |
| 107 | Moldova | 0.711 | 0.638 | 10.3 |
| 108 | Turkmenistan | 0.71 | 0.579 | 18.5 |
| 109 | Uzbekistan | 0.71 | ||
| 110 | Libya | 0.708 | ||
| 111 | Indonesia | 0.707 | 0.584 | 17.4 |
| 112 | Samoa | 0.707 | ||
| 113 | South Africa | 0.705 | 0.463 | 34.3 |
| 114 | Bolivia | 0.703 | 0.533 | 24.2 |
| 115 | Gabon | 0.702 | 0.544 | 22.5 |
| 116 | Egypt | 0.7 | 0.492 | 29.7 |
| 117 | Marshall Islands | 0.698 | ||
| 118 | Vietnam | 0.693 | 0.580 | 16.3 |
| 119 | Palestine | 0.69 | 0.597 | 13.5 |
| 120 | Iraq | 0.689 | 0.552 | 19.9 |
| 121 | Morocco | 0.676 | ||
| 122 | Kyrgyzstan | 0.674 | 0.610 | 9.5 |
| 123 | Guyana | 0.67 | 0.546 | 18.5 |
| 124 | Salvador | 0.667 | 0.521 | 21.9 |
| 125 | Tajikistan | 0.656 | 0.574 | 12.5 |
| 126 | Cape Verde | 0.651 | ||
| 127 | Nicaragua | 0.651 | 0.501 | 23 |
| 128 | Guatemala | 0.651 | 0.472 | 27.5 |
| 129 | India | 0.647 | 0.477 | 26.3 |
| 130 | Namibia | 0.645 | 0.417 | 35.3 |
| 131 | East Timor | 0.626 | 0.450 | 28.1 |
| 132 | Honduras | 0.623 | 0.464 | 25.5 |
| 133 | Kiribati | 0.623 | 100 | |
| 134 | Butane | 0.617 | 0.450 | 27.1 |
| 135 | Bangladesh | 0.614 | 0.465 | 24.3 |
| 136 | Micronesia | 0.614 | ||
| 137 | Sao Tome and Principe | 0.609 | 0.507 | 16.7 |
| 138 | Congo | 0.608 | 0.456 | 25 |
| 139 | Eswatini | 0.608 | 0.430 | 29.3 |
| 140 | Laos | 0.604 | 0.454 | 24.8 |
| 141 | Vanuatu | 0.597 | ||
| 142 | Ghana | 0.596 | 0.427 | 28.4 |
| 143 | Zambia | 0.591 | 0.394 | 33.3 |
| 144 | Equatorial Guinea | 0.588 | ||
| 145 | Myanmar | 0.584 | 0.448 | 23.3 |
| 146 | Cambodia | 0.581 | 0.465 | 20 |
| 147 | Nepal | 0.579 | 0.430 | 25.7 |
| 148 | Kenya | 0.579 | 0.426 | 26.4 |
| 149 | Angola | 0.574 | 0.392 | 31.7 |
| 150 | Zimbabwe | 0.563 | 0.434 | 22.9 |
| 151 | Cameroon | 0.563 | 0.371 | 34.1 |
| 152 | Pakistan | 0.56 | 0.386 | 31.1 |
| 153 | Solomon Islands | 0.557 | ||
| 154 | Syria | 0.549 | ||
| 155 | Papua New Guinea | 0.543 | ||
| 156 | Comoros | 0.538 | 0.294 | 45.4 |
| 157 | Rwanda | 0.536 | 0.382 | 28.7 |
| 158 | Nigeria | 0.534 | 0.349 | 34.6 |
| 159 | Tanzania | 0.528 | 0.397 | 24.8 |
| 160 | Uganda | 0.528 | 0.387 | 26.7 |
| 161 | Mauritania | 0.528 | 0.358 | 32.2 |
| 162 | Madagascar | 0.521 | 0.386 | 25.9 |
| 163 | Benin | 0.52 | 0.327 | 37.1 |
| 164 | Lesotho | 0.518 | 0.318 | 38.6 |
| 165 | Ivory Coast | 0.516 | 0.331 | 35.9 |
| 166 | Senegal | 0.514 | 0.347 | 32.5 |
| 167 | Togo | 0.513 | 0.350 | 31.8 |
| 168 | Sudan | 0.507 | 0.332 | 34.5 |
| 169 | Haiti | 0.503 | 0.299 | 40.6 |
| 170 | Afghanistan | 0.496 | ||
| 171 | Djibouti | 0.495 | ||
| 172 | Malawi | 0.485 | 0.346 | 28.7 |
| 173 | Ethiopia | 0.47 | 0.337 | 28.3 |
| 174 | Guinea | 0.466 | 0.310 | 33.5 |
| 175 | Gambia | 0.466 | 0.293 | 37.1 |
| 176 | Liberia | 0.465 | 0.314 | 32.5 |
| 177 | Yemen | 0.463 | 0.316 | 31.7 |
| 178 | Guinea-Bissau | 0.461 | 0.288 | 37.5 |
| 179 | DR Congo | 0.459 | 0.316 | 31.2 |
| 180 | Mozambique | 0.446 | 0.309 | 30.7 |
| 181 | Sierra Leone | 0.438 | 0.282 | 35.6 |
| 182 | Burkina Faso | 0.434 | 0.303 | 30.2 |
| 183 | Eritrea | 0.434 | ||
| 184 | Mali | 0.427 | 0.294 | 31.1 |
| 185 | Burundi | 0.423 | 0.296 | 30 |
| 186 | South Sudan | 0.413 | 0.264 | 36.1 |
| 187 | Chad | 0.401 | 0.250 | 37.7 |
| 188 | CAR | 0.381 | 0.222 | 41.7 |
| 189 | Niger | 0.377 | 0.272 | 27.9 |
China and Russia
China and Russia are among the most attractive countries for foreign investment. The Chinese economy is characterized by high economic growth and has the fastest development in the world.
The country is now the second largest economy in the world after the United States. However, China faces a number of social and demographic problems that prevent it from becoming a member of the “club of developed countries.” Most of the Chinese population spend their income on basic necessities and clothing. Each Chinese person accounts for much less GDP than an American or European.
According to the criteria, Russia is not considered a developed country, however, along with China, Russia belongs to the “newly industrialized countries”, because their industry is growing at a faster pace than the rest of the world. The country's economy is among the top 10 best economies in the world and continues to increase its GDP growth rate, despite economic sanctions.
However, Russia's problem is its serious dependence on energy exports (oil and gas). Therefore, in the coming years, Russia should rebuild its economy from a resource-based to a post-industrial one, because Natural resources are being depleted.
Rating of countries by GDP in table form
(based on purchasing power parity (PPP), IMF estimates, 2020)
| № | A country | GDP, billion dollars |
| 1 | China | 24 162 |
| 2 | USA | 20 807 |
| 3 | India | 8 681 |
| 4 | Japan | 5 236 |
| 5 | Germany | 4 454 |
| 6 | Russia | 4 021 |
| 7 | Indonesia | 3 328 |
| 8 | Brazil | 3 078 |
| 9 | Great Britain | 2 978 |
| 10 | France | 2 954 |
And now we will also briefly indicate the place of the remaining countries of the former USSR in the world ranking of countries by GDP.